Predicting french real estate sales from open data
27 Apr 2019
As the french government recently opened their real (real estate sales data), I was curious about trying to make accurate value predictions based on simple features such as geolocation, surfaces…
We will consider two kinds of product:
- Apartments: where the location and the surface will influence the value.
- Houses: where the location, the built surface and the ground surface will influence the value.
Apartments
Lets consider we want to predict the sale price on a 29 square meters apartment located at 31st rue Poissonnière, Paris:
address = "31 rue Poissonnière, Paris"
surface = 29
type = "apartment"
The first thing we want here is to query the database to geolocate the address to get its coordinates.
To achieve this, we will query the Nominatim API:
from geopy.geocoders import Nominatim

geolocator = Nominatim(user_agent="PireAgent")
location = geolocator.geocode(address)
location

'Location(31, Rue Poissonnière, Bonne-Nouvelle, 2e, Paris, Île-de-France, France métropolitaine, 75002, France, (48.86992, 2.3478161, 0.0))'
Let see if we correctly located the address:
from ipyleaflet import Map, Marker

center = (location.latitude, location.longitude)
map = Map(center=center, zoom=20)
marker = Marker(location=center, draggable=False)
map.add_layer(marker)
map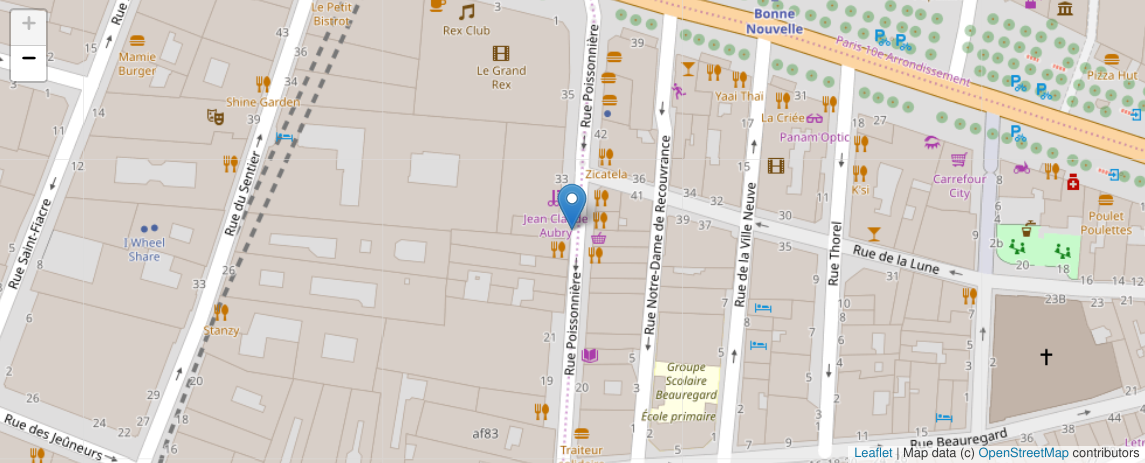
We now need to extract the nearest sales from our database to see if we can make a correlation between the feature we’ve got and the transaction value:
import os
import records

db = records.Database(os.environ["DATABASE_URL"])

query = """
    select
        surface,
        amount,
        center[0] as longitude,
        center[1] as latitude,
        address,
        geometry

    from sale

    where type=:type

    order by ST_Distance(
        point(:longitude, :latitude)::geometry,
        center::geometry
    ) limit 30;
"""

rows = db.query(query, latitude=location.latitude, longitude=location.longitude, type=type)
rows.as_dict()

[{'surface': Decimal('33'),
  'amount': 369000,
  'longitude': 2.3480286375,
  'latitude': 48.8698110625,
  'address': '30 Rue Poissonniere',
  'geometry': {'type': 'Polygon',
   'coordinates': [[[2.3479115, 48.8698237],
     [2.347906, 48.8697772],
     [2.3481629, 48.869774],
     [2.3481685, 48.8698214],
     [2.3480634, 48.8698227],
     [2.3480601, 48.8698227],
     [2.3480452, 48.8698231],
     [2.3479115, 48.8698237]]]}},
 ...
]
In order to choose the algorithm we’ll use for the prediction, we simply plot the values as:
import pandas
import matplotlib.pyplot as plot

dataframe = pandas.DataFrame.from_dict(rows.as_dict())
dataframe.sort_values(by=['surface'], inplace=True)
dataframe.plot(x="surface", y="amount")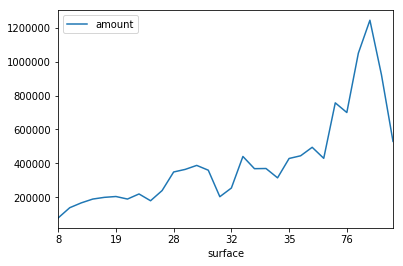
As we can see, the graph looks pretty linear, a simple linear regression model will do the job:
from sklearn import linear_model

model = linear_model.LinearRegression()
x = dataframe["surface"].values
x = x.reshape(len(x), 1)
y = dataframe["amount"].values.reshape(len(x), 1)
model.fit(x, y)

plot.scatter(x, y,  color='blue')
plot.plot(x, model.predict(x), color='red', linewidth=1)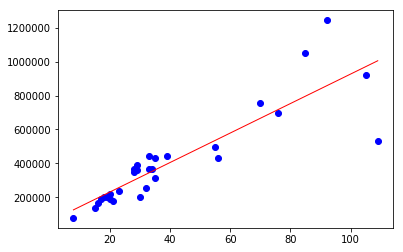
It’s time to predict our value!
value = int(model.predict([[surface]])[0])

f"€{value:,d}"
The model predicted a sale price of €309,027.
We now add the sales that occured within the neighborhood onto the map:
from ipywidgets import HTML
from ipyleaflet import Popup, Polygon
def map_sales(center, rows):
map = Map(center=center, zoom=18)
marker = Marker(location=center, draggable=False)
map.add_layer(marker)
for row in rows:
message = HTML()
message.value = f'{row["surface"]}m<sup>2</sup><br />€{row["amount"]:,d}<br />{row["address"]}'
popup = Popup(
location=(row["latitude"], row["longitude"]),
child=message,
close_button=False,
auto_close=False,
close_on_escape_key=False,
auto_pan=False,
)
marker = Marker(location=(row["latitude"], row["longitude"]), draggable=False)
marker.popup = message
map.add_layer(marker)
polygon = Polygon(
locations=[
(c[1], c[0])
for c in row["geometry"]["coordinates"][0]
],
color="green",
fill_color="green",
weight=1,
)
map.add_layer(polygon)
return map
map_sales(center, rows)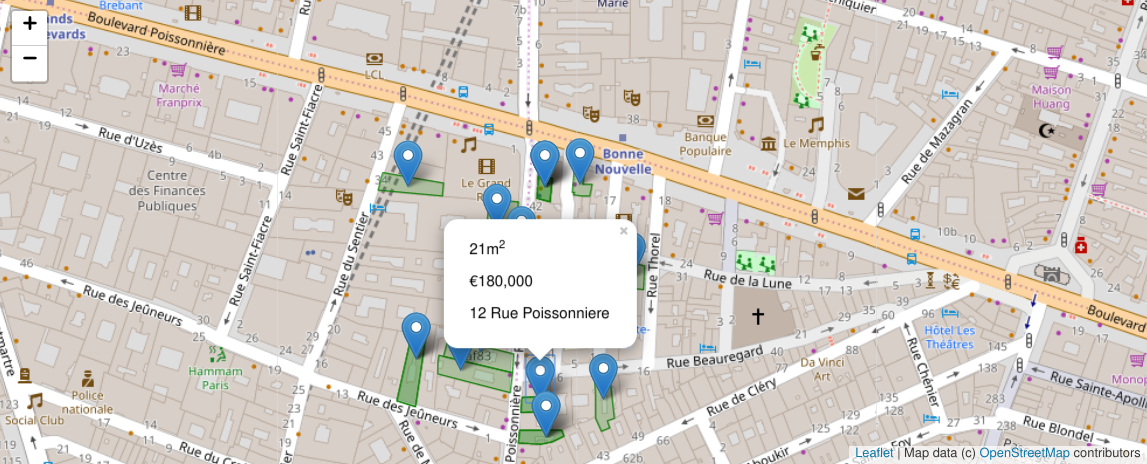
Houses
As previosuly mentioned, for houses we will use un extra feature (the ground surface) to compute our model.
The whole stuff could be re-written as:
def predict(address, type, surface, ground_surface=None):
    assert type in ("apartment", "house")

    # Locate the address
    location = geolocator.geocode(address)

    if location is None:
        raise ValueError("Unable to geocode the address")

    query = """
        select
            surface,
            ground_surface,
            amount,
            center[0] as longitude,
            center[1] as latitude,
            address,
            geometry

        from sale

        where type=:type

        order by ST_Distance(
            point(:longitude, :latitude)::geometry,
            center::geometry
        ) limit 30;
    """

    rows = db.query(query, latitude=location.latitude, longitude=location.longitude, type=type)

    # Fit a linear regression model
    dataframe = pandas.DataFrame.from_dict(rows.as_dict())
    model = linear_model.LinearRegression()
    y = dataframe["amount"].values
    y = y.reshape(len(y), 1)

    if type == "apartment":
        query = [surface]
        x = dataframe["surface"].values.reshape(len(y), 1)

    if type == 'house':
        query = [surface, ground_surface]
        x = dataframe[["surface", "ground_surface"]].values

    model.fit(x, y)

    # Make the prediction
    amount = int(model.predict([query])[0])

    # Return the data
    return dict(
        address=address,
        amount=amount,
        latitude=location.latitude,
        longitude=location.longitude,
        surface=surface,
        ground_surface=ground_surface,
        nearest=rows,
    )
We’re now able to predict the value of a 100 square meters house on a 900 square meters lot located at 172 Rue des Candinières, 34160 Castries
data = predict("172 Rue des Candinières, 34160 Castries", "house", 100, 900)
data

{'address': '172 Rue des Candinières, 34160 Castries',
 'amount': 360540,
 'latitude': 43.6768138,
 'longitude': 3.9913111,
 'surface': 100,
 'ground_surface': 900,
 'nearest': <RecordCollection size=30 pending=False>}
Displaying the results:
Looks like its value is about €360,540.
We display the neighborhood to have a deeper look:
map_sales((data["latitude"], data["longitude"]), data["nearest"])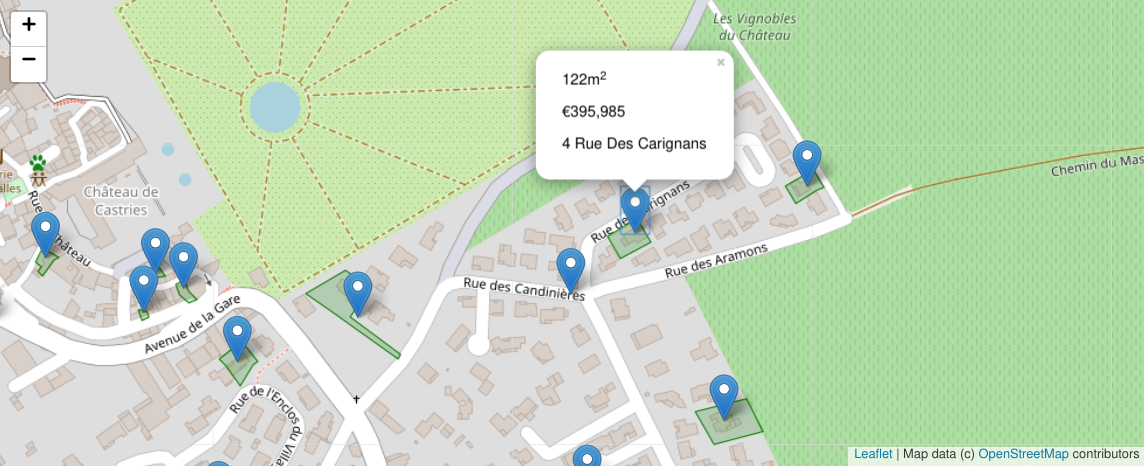
Going further
The algorithm here is quite simple and takes really basic features as inputs.
There’s a room for improvements:
- detect neighborhood types within country side areas (building density…)
- qualify the dataset (check for swimming pools from satellite layers, distance from the sea…)
- make prediction of future values
- detect unused high value lots
- best areas to invest in …